cTrader Visual Backtesting
Visual backtesting is a process used in various fields, such as finance and algorithmic trading, to evaluate the performance of a trading strategy by visually analyzing historical data. It involves simulating the execution of a trading strategy using past market data to assess how well the strategy would have performed in the past.
While the backtest is running you can simulate trades and performance on a chart or graph representing the historical price movements. Visual backtesting allows you to see how the strategy would have performed in different market conditions, identify potential strengths, weaknesses, and areas for improvement.
Getting Started
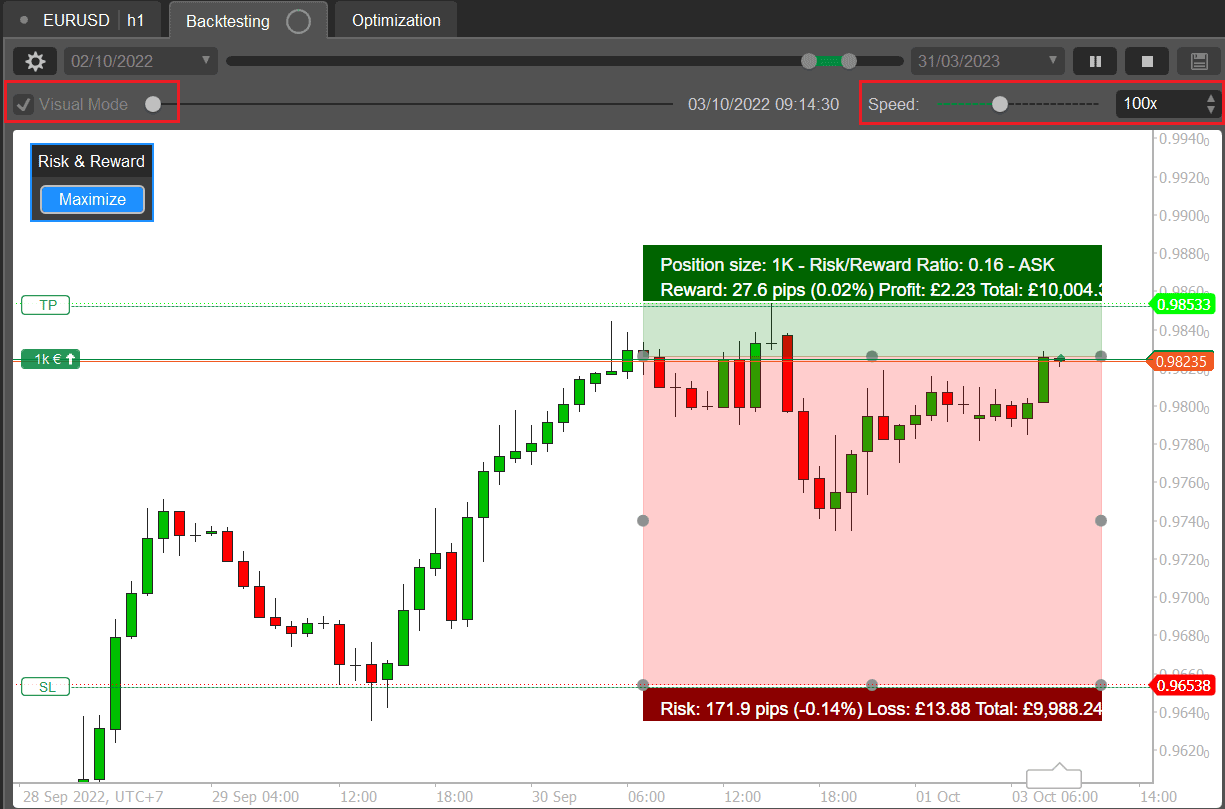
To use the Visual Backtest feature you first need to make sure you are using the cTrader Automate application, you can access this from the left hand panel. Once you are using the Automate application, click on the tab above the chart called Backtesting, this will open the backtesting module. To start a Visual backtest make sure you check the box above shown in red called Visual Mode, you then select you speed and start the test. While the test is running you can adjust the speed faster or slower.
It will visualize how the price moved for the historical data, this allows you to see how the market played out so you can make adjustments to your strategies, the image image shows one of our Risk & Reward Tool being used to setup trades with calculated risk and manually submit the orders.
Backtesting
If you uncheck the Visual Mode box and click on the start button, you will run a standard backest which will eventually show you the end results of the test, you will not visually see how trades were opened or managed in slow mode.