Moving Average Strategies
Moving average indicators are widely used tools in technical analysis, a field of study in financial markets that focuses on using historical price and volume data to make informed trading and investment decisions. These indicators are calculated to smooth out price data and help traders and analysts identify trends and potential reversals in a financial instrument's price.
Traders and market analysts frequently employ various timeframes when calculating moving averages to construct their charts and among the most commonly used periods for identifying substantial, extended support and resistance levels, as well as overall trends, are the 50-day, 100-day, and 200-day moving averages. These extended moving averages are considered more dependable trend indicators based on historical data and are less susceptible to short-term price fluctuations.
The 200-day moving average holds particular significance in the realm of stock trading and when a stock's 50-day moving average remains above the 200-day moving average, it is typically interpreted as being in a bullish trend and the downside crossover of the 200-day moving average is seen as a bearish signal.
For spotting near-term trend shifts, the 5-day, 10-day, 20-day, and 50-day moving averages are frequently employed where alterations in direction by these shorter-term moving averages are closely monitored as potential early indicators of longer-term trend changes. Crossovers involving the 50-day moving average with either the 10-day or 20-day moving average are deemed significant.
In intraday trading, the 10-day moving average plotted on an hourly chart is often used to provide guidance to traders.
Two of the most commonly used moving average indicators are Simple and Exponential, the choice between SMA and EMA depends on the trader's or analyst's specific goals and time horizon. Short-term traders often prefer EMA for its responsiveness to recent price changes, while longer-term investors might use SMA for a smoother trend analysis.
There are two types of moving average strategies you can use with the algo building tool.
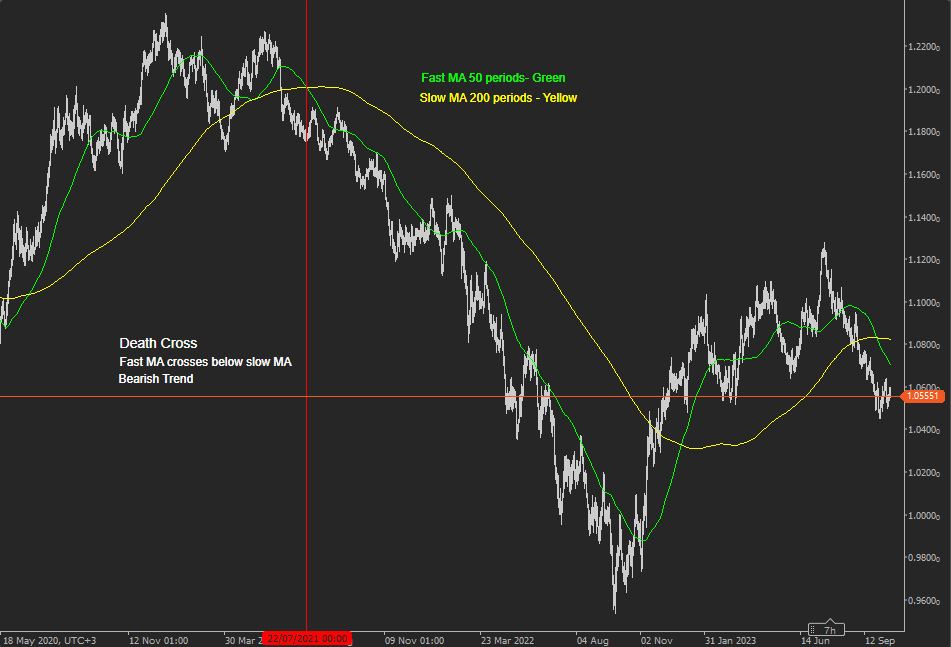
Golden & Death Cross Strategy
Crossover Signals: Crossovers between different moving averages, such as the "golden cross" (50-day SMA crossing above the 200-day SMA) and the "death cross" (50-day SMA crossing below the 200-day SMA), are used to signal potential changes in trend direction.
Price Crossover Strategy
You can also trade based on the symbols price crossing above or below the moving average.
The MA Crossover Strategy with Price Action is a strategy that helps in finding the midpoint of a trend that provides traders with price signals about when to long or short a trade. The two Moving Averages that can be used in this crossover strategy are the 50- period (short term) moving average and the 200-period (long term) moving average.
-
Whenever the 50-period MA crosses the 200-period MA from above, it indicates a market uptrend and signals traders to enter the market or go long to benefit from the uptrend.
-
Whenever the 50-period MA crosses the 200-period MA from below, it indicates a market downtrend and signals traders to exit or go short to benefit from the falling markets.
Remember that no trading strategy is foolproof, and it's essential to have a well-defined trading plan and risk management rules in place when using moving average price crossover strategies, it is also wise to stay updated on current market conditions and adjust your strategy accordingly.
Algo Strategy Builder
This strategy was built using the Algorithmic Strategy Building Tool with no coding experience. Full source code included.