On Balance Volume
The cTrader On-Balance Volume (OBV) indicator is a technical analysis tool used to measure buying and selling pressure in the market, it was developed by Joseph Granville and is based on the idea that volume precedes price movements. This type of indicator is a powerful tool for analyzing market sentiment and volume trends, and when used correctly, it can provide valuable insights into potential price movements.
Confirming Trends
Rising OBV: If OBV is increasing, it suggests that buying volume is higher than selling volume, indicating accumulation and supporting an upward price trend. Falling OBV: If OBV is decreasing, it suggests that selling volume is higher than buying volume, indicating distribution and supporting a downward price trend.
Identifying Divergences
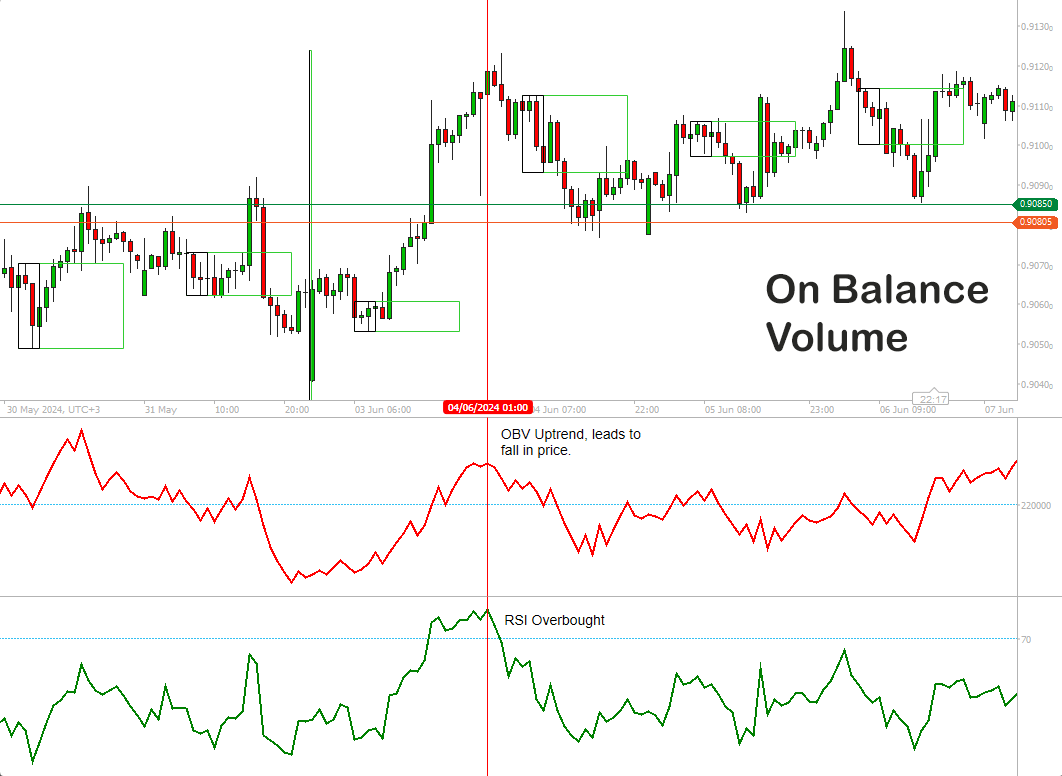
Bullish Divergence: If the price is falling but OBV is rising, it may indicate that the downtrend is losing momentum, and a reversal to the upside could be imminent. Bearish Divergence: If the price is rising but OBV is falling, it may indicate that the uptrend is losing momentum, and a reversal to the downside could be imminent.
RSI Confirmation
This strategy also uses a Relative Strength Indicator as shown on the chart above for an additional confirmation signal to enter a trade, the RSI is an excellent indicator to identify when a symbol is oversold or overbought.
Algo Strategy Builder
This strategy was built using the Algorithmic Strategy Building Tool with no coding experience. Full source code included.