RSI & SMA Strategy
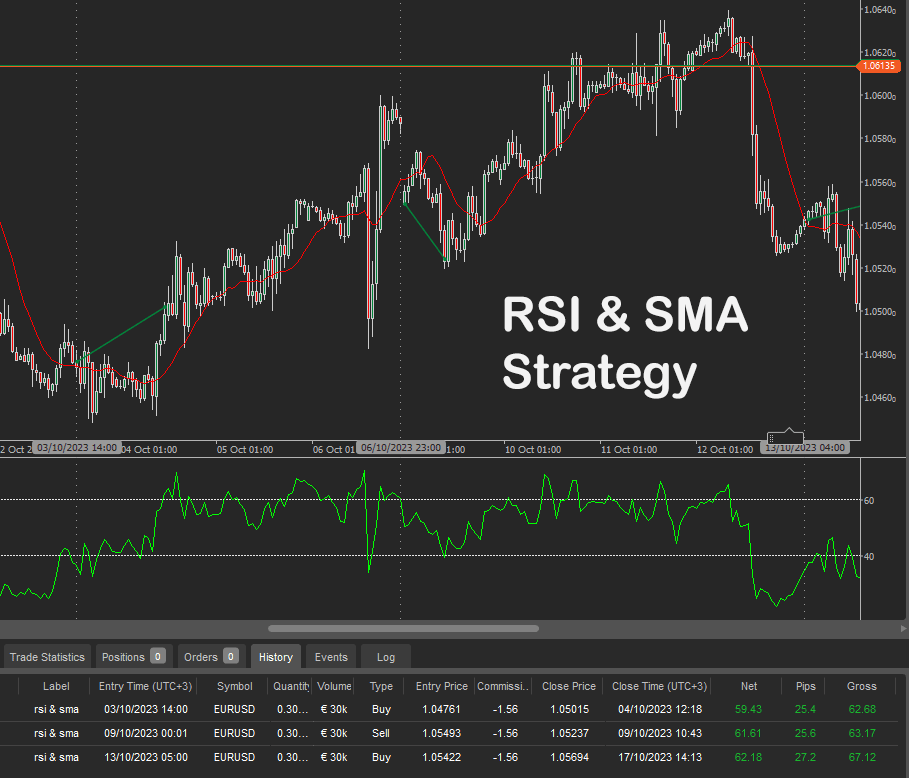
Adding a confirmation indicator like the Relative Strength Indicator to a Simple Moving Average indicator is a good method to capture both the trend and if a symbol is overbought or oversold, the following strategy uses a simple combination of a 1-hour timeframe with 14 periods. You can check the trades here by drawing a vertical line on the trade entry points.
Trade Rules
- Sell Trade = RSI > 60 and symbol price is below SMA.
- Buy Trade = RSI < 40 and symbol price is above SMA.
Algo Strategy Builder
This strategy was built using the Algorithmic Strategy Building Tool with no coding experience. Full source code included.