Supertrend & EMA Strategy
The EMA and SuperTrend Combined Trend Following Strategy skillfully merges the EMA and SuperTrend indicators to pinpoint market trends and offer precise entry and exit signals. This strategy supports customization of both SuperTrend and EMA parameters to match various trading styles. Entry timing is determined by crossover signals between the EMA and SuperTrend indicators. The exit rules are adaptable, allowing traders to exit either when the trend reverses or when the price recrosses the EMA, facilitating effective risk management.
The SuperTrend indicator was invented by Olivier Seban, a French trader and author, and he developed the SuperTrend indicator as a tool to help traders identify market trends and determine entry and exit points based on volatility. The indicator has since become popular in various trading platforms and strategies due to its effectiveness and simplicity.
Trading Signals
Long Signal: The price of the symbol must be above the Supertrend uptrend (green) and the previous Supertrend candle signal was bearish. As a confirmation the symbol price must be above the Exponential Moving Average (EMA) line.
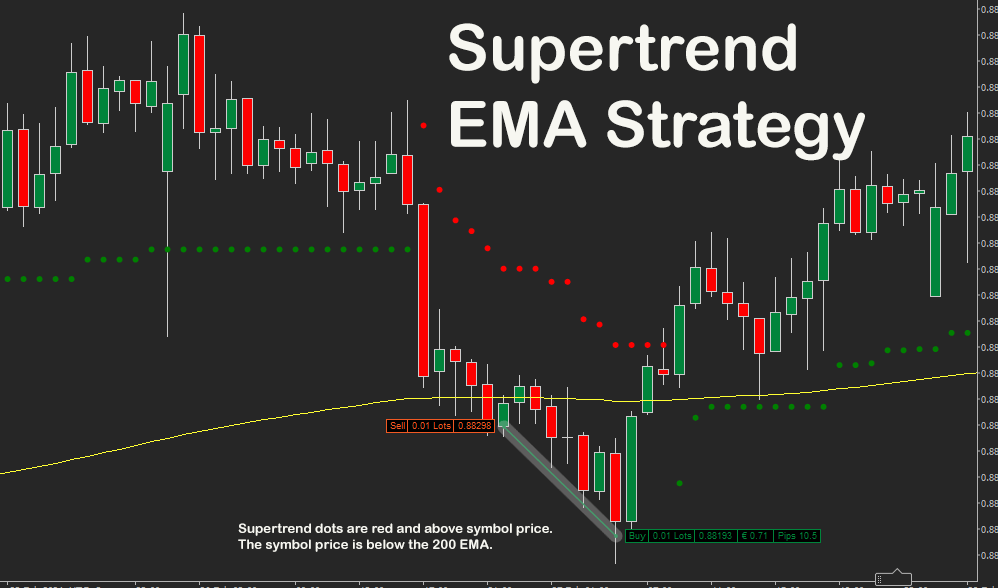
Short Signal: The price of the symbol must be below the Supertrend downtrend (red) and the previous Supertrend candle signal was bullish. As a confirmation the symbol price must be below the Exponential Moving Average (EMA) line.
EMA Confirmation
This strategy also uses the Exponential Moving Average (EMA) Indicator as shown on the chart as the yellow line for an additional confirmation signal to enter a trade, a 200 period is a good setting to capture trend direction.
Repainting Issues
You may notice that when looking at historical trades on the chart there is a sell trade when you see a green dot for a bullish uptrend, this can happen when the indicator repaints.
Algo Strategy Builder
This strategy was built using the Algorithmic Strategy Building Tool with no coding experience. Full source code included.