TradingView Backtest Analysis with AI
Analyse Strategy lets you perform detailed TradingView backtest analysis using trade data exported from the TradingView Strategy Tester.
The strategy does not need to have been created by Xen, and the analysis does not inspect Pine Script source code or an existing Xen project. Run the backtest in TradingView first, then export the Strategy Tester List of Trades as a CSV file.
The CSV file must contain trade data and be no larger than 2 MB.
TradingView can represent entries and exits across multiple rows. Xen normalises the exported data into completed trades before calculating statistics, which helps avoid double-counting caused by the raw CSV structure.
GPT 5.6 Luna then reviews the normalised trades together with the calculated performance data and generates a structured analysis report.
Export TradingView backtest results
Open your strategy in TradingView and run it through the Strategy Tester.
From the Strategy Tester results, export the List of Trades as a CSV file.
In Xen:
- Choose Analyse Strategy.
- Select Add CSV file.
- Upload one TradingView List of Trades export.
- Wait for Xen to validate the file and identify the completed trades.
- Add optional instructions if you want the report to focus on a particular area.
- Select Analyse trade report.
Optional instructions can be useful when you want Xen to investigate something specific, such as maximum drawdown, long and short performance, losing streaks, outlier trades or a particular out-of-sample period.
Analyse the TradingView backtest report
Xen generates a structured report from the supplied trades.
Depending on the available data, the report can analyse:
- Net profit
- Gross profit and gross loss
- Number of completed trades
- Win rate
- Average winning and losing trades
- Profit factor
- Payoff ratio
- Maximum drawdown
- Losing and winning streaks
- Long and short trade performance
- Average trade performance
- Trade duration
- Favourable and adverse excursion
- Performance across different periods
- Dependence on unusually large winning trades
- Missing commission or slippage assumptions
- Data inconsistencies in the TradingView export
The report also highlights areas where the available evidence is weak or incomplete rather than treating every backtest statistic as reliable.
Review risk and robustness
A TradingView backtest can appear profitable while still containing weaknesses that are not obvious from the headline Strategy Tester figures.
Xen can examine whether performance depends heavily on a small number of trades, whether prolonged drawdowns occurred, whether long and short trades behave differently, and whether results are concentrated in particular historical periods.
The report can also identify missing information that may materially affect the results, including:
- Commission
- Slippage
- Spread assumptions
- Chart timeframe
- Starting capital
- Position sizing
- Strategy parameters
- Execution assumptions
These factors are important when interpreting a backtest because apparently small costs or execution differences can materially affect a strategy with a narrow historical edge.
Identify further tests
The report does more than summarise historical performance. It can also suggest additional tests that may help determine whether the strategy is reasonably robust.
These can include:
- Out-of-sample testing
- Walk-forward testing
- Testing different symbols or market conditions
- Parameter perturbation
- Testing nearby strategy settings
- Comparing long and short performance separately
- Removing the largest winning trades and recalculating results
- Re-running the backtest with realistic commissions and slippage
The aim is to determine whether the observed performance is reasonably stable or whether it depends on one particular configuration or historical period.
Save the analysis report
Use Save report as PDF to open the browser print view and save a copy of the completed TradingView backtest analysis.
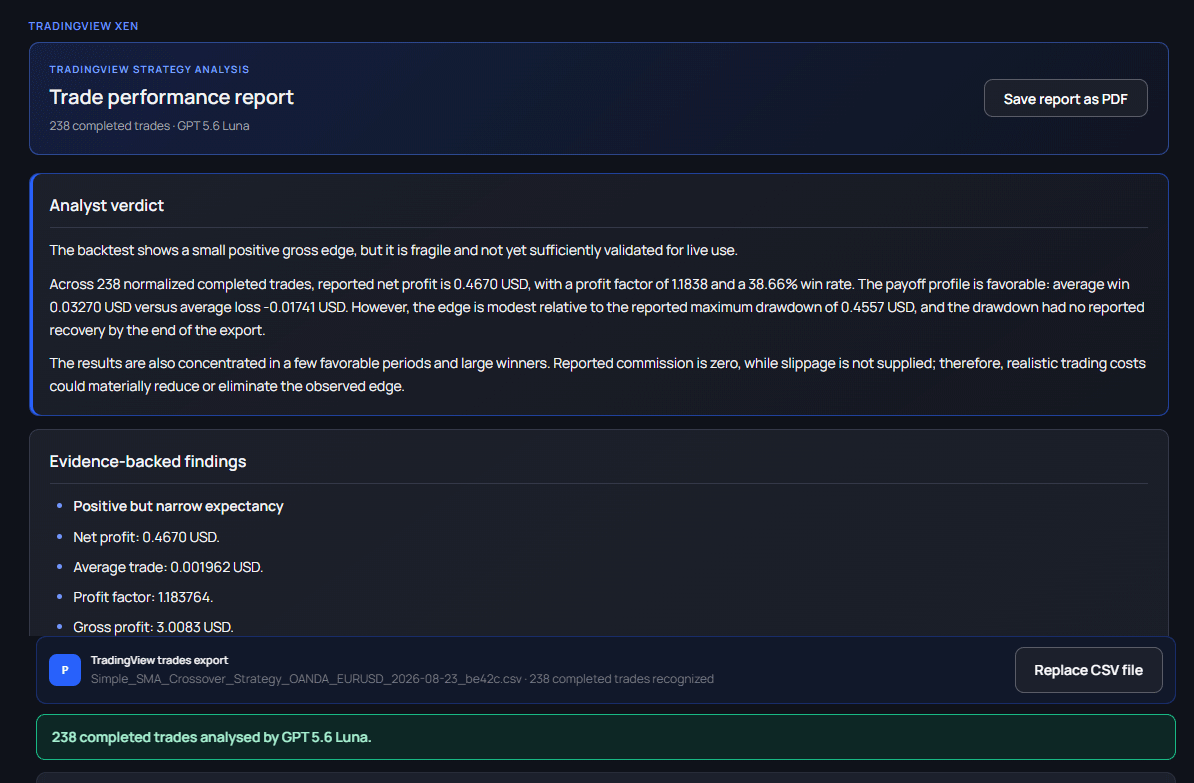
The saved report can be useful when comparing different strategy versions, parameter settings or testing periods.
Interpret TradingView backtest results carefully
A profitable historical backtest does not prove that a strategy will remain profitable.
Before relying on the results, confirm that commission, slippage, chart type, symbol, timeframe, date range, position sizing and order settings represent the conditions you intend to trade.
The Xen report analyses the supplied TradingView trade data. It does not prove that the strategy source code matches its original requirements, and it cannot establish that TradingView's simulated fills will match future market execution.
If the analysis identifies a possible improvement, open the Pine Script separately using Existing Strategy and make one controlled change at a time.
Run the strategy through the TradingView Strategy Tester again and compare the new results using appropriate in-sample and out-of-sample data. This makes it easier to determine whether a change improved the strategy or simply fitted one historical backtest.